DSO ANALYTICS, REPORTING AND PAYMENT TRENDING
Online, real time
global reporting across
all businesses and countries
- Consolidated global data for all BUs / Countries and Products driving best practice OTC monitoring and targeting
- Dashboard cloud-portal for senior management and detailed tabular reports for ops management
- Integrated into software or stand-alone
- Enabling full analytics window on the business
Manage O2C teams –
Remotely – through Reporting, SLAs, Targets
- Global performance reporting and monitoring through consolidated reporting suite
- Target teams and individuals wherever they are from one central screen
- Trickle down targets for all layers of OTC management
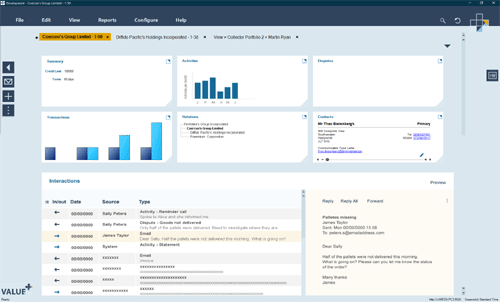
Dashboards
Based on more than three decades of experience, the Dashboard has been developed to provide senior executives with the insight and control they need to get the most from corporate cash resources.
CFO Management View
CFO Dashboard is available to monitor working capital movements at one glance.
Comprehensive Reporting System
Reporting ability to provide continuously updated picture of working capital performance across even the most complex business.
Breath and Depth Reporting
Providing reporting details across any given period or currency, by division, region or business unit, across receivable, payables and inventory.
Appropriate Info available
This Dashboard gives you exactly the information you need through quick and simple customisation by the individual user.
Ease of use
Reporting containing an intuitive graphics-based system that can quickly switch from company-wide overview to in-depth investigation.
Reporting
Transparency and Automated Reporting
Visibility of reporting across the organisation. Ability to automate reporting distribution based on roles and responsibilities.
Filtered Information
Data contained in the reports can be filtered, selected and illustrated accordingly. Performance management can be measured and data extrapolated in as many ways as possible. Reports can be extracted and generated by Collector, Collections Team, Customer, Customer Type, Business Unit, Company, Dispute Identifier, Dispute Resolver etc.
Exporting Facility
Any report can be exported in excel for further analysis and personalised activities.
Management View
Management Dashboard and reports detailing current and historical team’s performance on both Collection Management and Customer Service.
Collection Reporting
Detailed operational reporting including performance management in the areas of: DSO and Best Possible DSO, Pareto Analysis, Cash Targeting, Customer Payment Performance, Aged Debt Profile, Overdue Debt and Unallocated Cash.
Customer Service Reporting
Detailed operational reporting in the area of Dispute and Query Management and Customer Service including: Dispute Surfacing and Resolution Cycle Time, Payment and Closure Cycle Time, Dispute Ageing, Dispute Causal Analysis and Dispute/Query Throughput, Customer Churn Analysis and prediction.
Process Cost Management
Report on AR and Customer Service processes are made visible through process cost related reports and dashboards and can be accessed at both management and operational level. This also allows identifying customers with high process management and operational maintenance costs.
DSO Trend
DSO trend analysis is measured against Best Possible DSO. Can be viewed on screen by customer and can be visualised by the day, month and year. Reporting can be produced by a number of variables. For instance: Customer, Customer type, Collector, Collector team, Sales agents, Sales channel, Segment, Segments group, Business Units, Total company, etc.
Aged Debt Analysis
This is a measure of the value of overdue trade receivables represented in age buckets. This measure compares the value of aged debt month on month and focuses attention on the absolute values not being collected to terms and the amount of time that they have been overdue. On demand analysis is provided on an account basis, or by different variables as per DSO report. The software has the ability to illustrate up to ten ageing buckets, catering for different markets and geographical regions.
Clearance/Rollover Analysis
This analysis shows how much of the debt is not being collected from each ageing bucket (e.g. 1-30 days old) and is consequently ‘rolling’ over to the next month. Outstanding debt is shown as a percentage of the original current debt, therefore also indicating the percentage of cash collected on time. The objective of this measure is to compare the percentages month on month which are not collected (rollover) from one aging bucket to the next.
Promise Management & Forecasting
Promises for payment are collated and analysed to provide income forecasts. Users can incorporate their own cash forecasting formula to produce bespoke cash flow reports for future months: one, six, twelve and fourteen months.
Collector Performance
Collectors performance statistics provide analysis of individual and group productivity levels. Users can be monitored by number of tasks raised on a given time frame, completion times, call attempts, cash promised, successful calls, letters generated, payment plans created, disputed invoices raised and activities closed.
Risk Exposure
Credit risk, including work in progress, can be analysed at a customer, regional and global level.
Workload Forecasting
Future activities can be collated to provide the workload projections for a particular date or range of dates.